COOP Spring 2024 Data Analysys Capstone

Collaborated with another data analyst fellow to create a data-driven visualization project where we viewed and worked with data in 3 different analyst roles; Audience, Inventory, and Spatial. With these roles, we were tasked to analyze and interpret data as if it were a professional workplace setting to bring out insights and issues using KPIs within the data-set that was presented to us.
International Carbon Credit Proposal Data Analysis

Collaborated with anoher other data analyst fellow to create a data-driven visualization project regarding the international carbon credit program with a proposal to the Environmental Protection Agency. Displaying data visualizations that incentivize and target the top 6 countries that emit carbon fuel to participate in decreasing their carbon emission so that the world can become carbon neutral by 2030.
Colonialismo Moderno: U.S. Expats in Mexico City
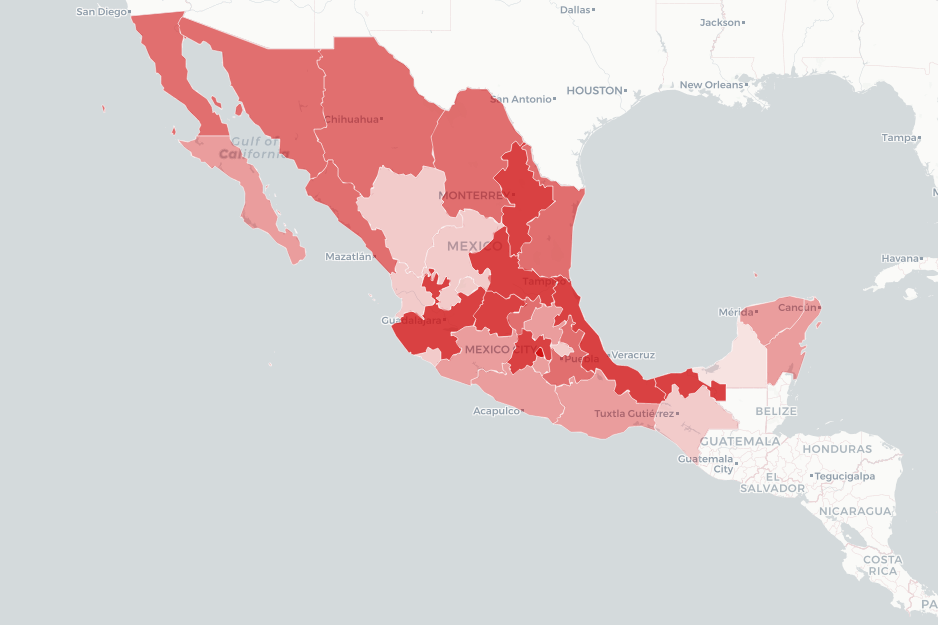
Independent research based project geared towards current events happening in Mexico City and its influx of U.S. expats since the start of the COVID-19 pandemic creating a new wave of gentrification. Research looks on the economic situation in Mexico covering the inflation of the real-estate market, produce, goods, other services and the increasing COVID-19 rates due to the rise of U.S. expats relocating in Mexico.
Bike It! - A Metro Bike Share Analysis
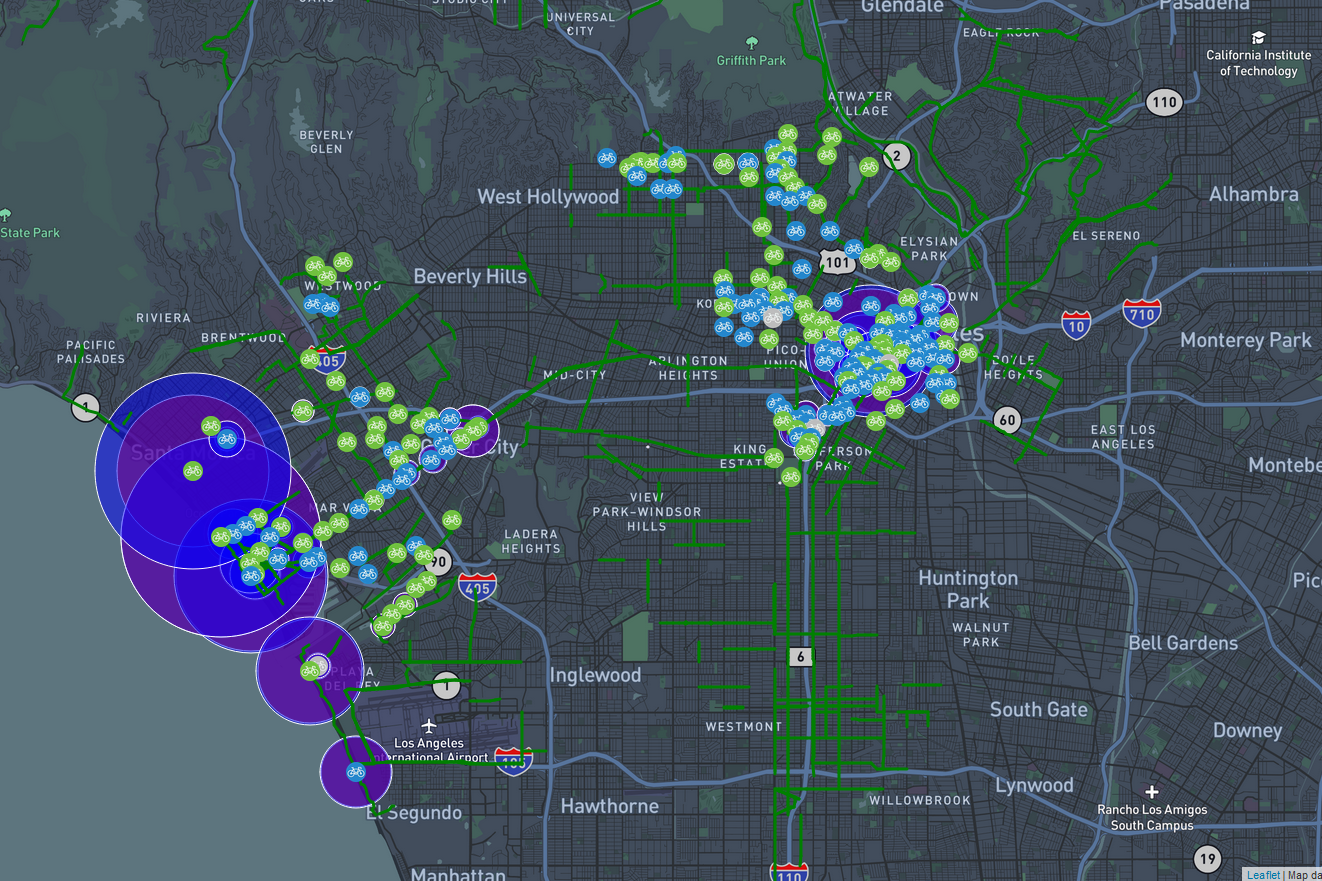
Collaborated with 2 other undergraduates in a Urban Humanities GIS web-based mapping site for researching neighborhoods that may include queryable statistical layers on Metro Bike Share transportation dataset to be able to examine the trends of bike-share usage and look for solutions to enhance the program.